Erlang/OTP 21's new logger
With OTP-21 came a new logging library in Erlang called logger. It comes as an attempt to offer a built-in alternative to long successful projects such as lager, which have seen years of battle testing and tweaking for performance. I've seen few articles written about the new logger and what it can do, so I've decided to do just that.
Lager came with a lot of performance adjustments, and structurally speaking, the new logger should be pretty fast. However, I do not know and have not measured if it is indeed the case, and I will leave this question for someone else to answer (I do believe there's a talk coming at this spring's CodeBeamSF on the topic). Instead, in this post, I'll look at the capabilities and structure of logger, to see what its new API allows and enables in projects.
Spoiler alert: I think we can finally get amazing structured logging that hits all the points when it comes to logging flexibility, and I'll show how this can be done, along with some theory of what good logging should be.
Structure
The logger library has an interesting internal structure. It's not necessary to know about it to use the library, but it is useful to know about it when we want to extend it. This extensibility is something we'll go through a bit later, since it really makes the library shine.
logger exposes three types of components with well-defined behaviours (interfaces):
- Log Filters
- Log Handlers
- Log Formatters
These three types of elements are stored in a configuration database. The configuration database is an opaque set of OTP processes that hold all the data in an ETS table so it's fast of access (something lager did as well), but that could very well be written using the OTP Persistent Term Storage that could land in the language starting with Erlang/OTP 22.0 somewhere around mid-2019. In any case, accessing the configuration should be cheap, and should reasonably not be a critical bottleneck.
This is important because it allows logging operations to take place closer to the calling source. In multiple programming languages where concurrency is rather limited, the thing you want to do is to log something, and as soon as possible, move it to a different thread or process so that your main one can keep running uninterrupted. This tends to work well when you have few of them, or when scheduling is cooperative:
 [P1]        [Logger]        [P2]
  |             |             |
  |---> log --->|             |
  |             |<--- log <---|
  |             |             |
  |             |             |
 ...           ...           ...
If formatting and writing out the log is costly, then P1 and P2 are allowed to keep going without much of a problem, and as the logging process or thread is stalled on some disk operation, the program keeps chugging along fine.
This is not the case in a language like Erlang or Elixir, where you can safely assume that if you have 32 cores, the 32 of them will be fully used, and all of that stuff you're doing has a different cost. For starters, since you're using processes for sure and not threads, you get a copying cost for your messages. But the biggest problem strictly comes from the point of view that Erlang has preemptive scheduling, and so there is no guarantee that a central process will necessarily get all of the CPU time it needs to flush data out—aside from raising the process' priority, but if not done carefully, you can hog a scheduler and make everything rather unfair.
In any case, you want to avoid the pattern where a lot of work is done on a single process while a lot of others can just produce logs for cheap:
 [P1]        [Logger]        [P2]
  |             |             |
  |----> A ---->|             |
  |          filter(A)        |
  |          format(A)        |
  |             |<---- B <----|
  |----> C ---->|             |
  |          output(A)        |
  |          filter(B)        |
  |             |<---- D <----|
  |          format(B)        |
  |----> E ---->|             |
  |          output(B)        |
  |          filter(C)        |
 ...           ...           ...
This is, to put it bluntly, introducing an infrastructural bottleneck into your system. You can cheaply and easily overload the central logger by spawning a lot of short-lived processes that send only one log line, and pretty much no backpressure mechanisms will be able to do anything about it without dropping logs blindly.
Instead, what we want is to distribute as much of the work as possible at the call-site. Under a systematic view, it is better to have some frequent minor disruptions (hopefully so small they are not noticeable) than it would be to cause overall system imbalance that everyone notices for long periods of time. It's a bit of a tradeoff between magnitude and frequency of instabilities. By putting all logging operations at the call-site you instead get an execution flow that looks like:
    [P1]        [Logger]        [P2]
     |             |             |
 filter(A)         |             |
 format(A)         |          filter(B)
     |----> A ---->|          format(B)
     |             |<---- B <----|
 filter(C)      output(A)        |
 format(C)      output(B)     filter(D)
     |----> C ---->|          format(D)
     |             |<---- D <----|
 filter(E)      output(C)        |
     |          output(D)        |
    ...           ...           ...
The logger process essentially is left with far less work to do, and whenever a log message is filtered—for example, having a debug log when the log level is set to error—it comes at no cost from the central logger process. In the diagram above, filter(E) does just that. You still need a backpressure mechanism and the possibility to shed load by dropping logs, but chances are it will be far more rare since the bottleneck isn't nearly as narrow and structural. And if the load shedding can take place from the call-site as well (by sticking it in a filter, for example), then you can fix every overload event by shedding far fewer logs for a shorter period of time.
And so logger adopts this structure. By having the configuration for logs in a central store that is cheap to read concurrently, everything is in place for rapid dispatching and filtering of events at the call-site.
Data Flow
For every log call, the following steps conceptually take place in the caller process:
- the level and calling module of the log are checked against a list of global permissions to know if the logging can go further; log level and module blacklists can be set at a node-global scope to quickly filter many logs in or out of the system
- the format of the log's arguments are validated and annotated. String logs, format logs (such as arguments you'd pass to
io:format/2), or reports (a data structure) are supported - the locality of logs is checked: a process can log up to another parent Erlang VM or node. For this we'll assume it's all on a single local node
- the "primary" (node-global) configuration is fetched
- a list of primary filter callbacks is fetched
- filters are executed one after the other; they can return whether to stop the log dead in its track (
stop), to log it (return the potentially altered log line), or to let another filter decide (ignore). - a list of log handlers is fetched
For each log handler, the following is done:
- a list of handler-specific filters is fetched
- the list of filters is applied as in step 6
- the
log/2callback is called for the log handler
At this point, we've gone through a set of level and module filters, a list of global filters, and then per-handler filters. All the logs past this point, for each handler, are considered to be clear and ready to format and output. Formatting is left up to each handler, but the OTP team has created a formatter behaviour so that a uniform format could be used.
Each handler that decides to do so can let you specify a custom formatter, such as flatlog, and will then redirect the output the way you want it to whatever back-end it needs. So if your handler just outputs to the terminal, it may decide to format the data and then call an output function right there and then. If it instead has to write to disk (as with logger_disk_log_h), however, it may decide to format the logs and then send them to a third party process that handles the output.
So for disk logging, what you likely have is a single process holding a file descriptor, ensuring that none of the write clash with each other. It can batch up log lines into page-sized payloads that get written one after the other.
In the end, the processing flow looks a bit like this:
 [level + module filter] --> [global filters] --> [handler]
                                                     |
         [handler callback] <-- [handler filters] <--|
                 +                            ... <--'
             [format]
                 |
     ============|==== process =============================
                 |
                 '--> [output]
This is the real clever stuff: if you don't need centralized processing, you don't get it. Most loggers, lager and Elixir's Logger library included, will use a central event handler for which all logs are forwarded before calling custom handlers. With the new OTP logger, if a specific log needs to be sent to 4 different backends (console, disk, audit, crash log), that process pays that cost; but if a request log is used only for one back-end, it is not being held up by unrelated ones.
This covers the information flow of what I now consider to be a good logger, but to make sense of that, let me also tell what I think makes for good logging.
Good Logging
Good logging is not necessarily obvious to get right, and you get better at logging once you've seen enough terrible and useless logs to know what to avoid. Eventually, you know enough mistakes to head in a generally good direction. In a nutshell, good logging requires to remain factual—don't interpret without context—and a strong separation of concerns between log producing and log consuming. Generally, all of this is easier to accomplish through structured logging.
State facts
The first thing to do with your logging is to be clear about your messages' content. You have to be aware that whatever you state in logs is what people debugging your system will operate with. Whatever you say in your logs will, whether you want it or not, influence how people approach debugging your system.
If your log says something to the effect of "the image upload service is down" instead of "could not connect to upload service at <domain> with <ip>:<port> for reason <reason>", you may be training your users and operators to do either or both of:
- go on a wild goose chase to figure out whether the image service is down
- distrust the log messages as unreliable and essentially useless
While the former log may be looking friendlier by trying to offer an interpretation, it is generally worse in all the cases except those where it is right. So if any problems exist with a load balancer, local firewall rules, cross-region calls, certificate validation, local resource exhaustion in sockets, the operator will not know about them. If the operator gets information from dashboards that tell them the upload service is healthy, the log line is disregarded as unreliable rather than as valuable (one side claims to be unable to connect whereas other parts of the system can connect fine).
The worst example of this I recall seeing is an old piece of software that would report any impossibility to validate SSL certificates as "you are being hacked!". So necessarily, when the software became too old to properly connect to online services using newer ciphersuites and protocols, it started to tell the person that their entire network was compromised, possibly having them call their IT department (or knowledgeable relative) to figure things out from opaque reports, rather than giving information to someone knowledgeable.
Of course, you have to cater to the level of expertise for your users, but you have to be careful between trying to be helpful in offering a guess, and obfuscating the truth. It may be better to say "certificate validation failed" than "you are being hacked", simply because a non-technical user would not necessarily know what to do about being hacked any more than bad certificate validation anyway.
Log Storage and Consuming are Unrelated Concerns
One of the biggest "mistakes" I see in various frameworks is tying down the output format and location directly to the source of the message being sent. The production and consuming of logs are different things done in different contexts by different people, and should be treated as such. Log production should be concerned with some output performance and specific retention policies, whereas log consuming is more about extracting various types of information from unpredictable patterns.
Some of the worst offenders I've seen here were object-oriented projects where logs would be stored on a per-class basis. Each class would instantiate its own logger, which would then write logs to a file defined for each class name. The problem with this extreme approach is that it does not play well for retention policies.
You want to be able to store and keep logs for various periods of time depending on who uses them.
For a developer trying to understand things in staging, you may want to have all the logs all the time, since the dev may need to see all kinds of noise and data to make sense of it. However, that data probably needs to be stored for a short period of time.
For application users and the information required for support tickets, you might want to store data for maybe 2-3 weeks. Give the customer a few days to find about the problem, confirm it's not on their end, open up a support ticket, let the support ticket escalate a few levels, land on a development team's lap, and then give developers time to address, investigate, and respond to the ticket: you might need 2-3 weeks but no longer than that. If the relevant logs are kept only for 3 days, then no ticket escalation can provide more insight than the lowest level because the data is gone.
For legal and audit purposes, you may want to store all logs related to configuration changes, user logins and logouts, purchases and financial transactions, and so on. You will possibly want to store them for 6 months or more. Many of these may be generated at an info level only, a level much lower than warnings, errors, or crash logs, which you might not want for that long.
And so the log's content itself should let you filter and redirect logs based on their importance. If you do the dispatching on files on disk, then the retention policies of your logger itself should let you set these. If you do the dispatching in the application so they go to different services, you will want to be able to do the dispatching at a logical level within the application. If you do the dispatching at another service after having aggregated everything in one feed through some log aggregation mechanism, then once again you need the logs to contain the information necessary to their parsing and storage.
In very few of these cases it is a good idea to clog up the code producing the logs with these concerns. It should be a bit worrisome to see 4 or 5 potential log consumers result in a single function generating 4-5 log calls directly. That's hardly maintainable.
So what you want is to have a single way to produce logs, and then, based on the log information, be able to dynamically dispatch them to the proper storage mechanisms, which implement the proper retention policies, which will get you appropriate performance. If all of your classes in an OO system generate a lot of logs to the point it causes performance issues, it may be fine to generate per-class logs going to various storage points, as long as they are re-aggregated later—pity the devs who use a text editor and comb through logs by hand—but it has to be done for a good reason.
The Advantages of Structured Logging
And here we are, with the need for factual logs, to be consumed by various yet-unknown entities, which need to be dynamically dispatchable based on their content. The most logical conclusion is that all logs generated should be generated with an easily parseable format that is also human-readable. This is what structured logging is all about.
The two big examples of structured logs are those using key-value pairs and look a bit like:
when=2018-07-11T13:41:10.14012+00:00 level=info id=10ba038e-48da-487b-96e8 \
at=my_app:some_call:123 log=event in=my_rel/my_app what=container_backup \
result=error reason="filesystem full" container_id=0 \
container_path="/containers/containers-data/cname" container_status=up
And those that use a data serialization format such as JSON, providing similar logs under the format:
{"level": "info",
 "id": "10ba038e-48da-487b-96e8",
 "at": "my_app:some_call:123",
 "when": "2018-07-11T13:41:10.14012+00:00",
 "log": "event",
 "in": "my_rel/my_app",
 "what": "container_backup",
 "result": "error",
 "reason": "filesystem_full",
 "container": {
    "id": 0,
    "path": "/containers/containers-data/cname",
    "status": "up"
 }
}
The former has the advantage of working well with line-based tools (such as syslog transports, grep and awk, and human readers), whereas the latter makes it really easy to build programmatic tools which can analyse data with little data loss in the original serialisation.
If you are really performance-cautious, you may want to generate the line format by hand since you can essentially output one flat log cheaply after having spent time serializing everything yourself, but you'll introduce a bunch of edge cases around serialization. What if the HTTP path that a user requested contains ?query="key=value" in there? Will you generate properly parseable data?
Instead, a safer although a bit more costly approach, is to straight up generate reports as maps or structs or well-known key-value data types in your language of choice. In Erlang those might be key-value pairs or maps. Maps are preferable because they allow much faster and efficient filtering for various structures, which let you keep some of your performance in any early validation and transformations you may wish to apply.
Here's how you could write a log expression in Erlang starting with OTP-21:
logger:info(#{
    id => "10ba038e", in => "some_component", what => "config_change",
    result => "error", reason => "unauthorized",
    "user" => #{"id" => 1337, "name" => "ferd", "role" => "member"}
}).
Which results in this output by default:
=INFO REPORT==== 25-Nov-2018::09:49:23.433329 ===
    id: 10ba038e
    in: some_component
    reason: unauthorized
    result: error
    "user": #{"id" => 1337,"name" => "ferd","role" => "member"}
    what: config_change
If you then add a custom log formatter using something like this in your sys.config file:
[
 {kernel, [
  {logger, [
    {handler, structured, logger_std_h,
       #{formatter => {flatlog, #{
         map_depth => 3,
         term_depth => 50
        }}}
    }
  ]}
 ]}
].
And switch to using a macro-based call, which will automatically inject metadata about the call-site into the logs:
-include_lib("kernel/include/logger.hrl").

...

?LOG_INFO(#{
    id => "10ba038e", in => "some_component", what => "config_change",
    result => "error", reason => "unauthorized",
    "user" => #{"id" => 1337, "name" => "ferd", "role" => "member"}
}).
You will get logs like this, with all the extra metadata:
when=2018-11-25T14:49:26.24935+00:00 level=info pid=<0.133.0> \
at=logchk:macro/0:14 what=config_change user_role=member user_name=ferd \
user_id=1337 result=error reason=unauthorized in=some_component id=10ba038e
So what's good with this is that you are able to get a structured log format that is amenable to tooling, but also still really effective to manipulate in logger's filters.
Tying it up
Since we've seen concerns about data production, storage, rotation, forwarding, and formatting, we might want to put a fully working solution together.
Using only built-in logging facilities in Erlang, we're able to do something like this:
[
 {kernel, [
  {logger_level, info},
  {logger, [
    %% Console logger
    {handler, default, logger_std_h,
       #{formatter => {flatlog, #{
         map_depth => 3,
         term_depth => 50
        }}}
    },
    %% Disk logger for errors
    {handler, disk_log, logger_disk_log_h,
       #{config => #{
            file => "logs/error",
            type => wrap,
            max_no_files => 10,
            max_no_bytes => 52428800, % 10 x 5mb
         },
         level => error,
         formatter => {flatlog, #{
           map_depth => 3,
           term_depth => 50
         }}
        }
    },

    %% Synchronous Audit logs
    {handler, audit_log, logger_disk_log_h,
       #{config => #{
            file => "logs/audit",
            type => wrap,
            max_no_files => 50,
            max_no_bytes => 52428800, % 50 x 5mb
            sync_mode_qlen => 0, % handle all events synchronously
            filesync_repeat_interval => 100, % fsync after 100ms when a change is made
            %% drop overload control
            drop_mode_qlen => 100000000, % ridiculously large queue before we drop
            flush_qlen => 100000001, % ensure we pretty much never drop silently
            burst_limit_enable => false, % no burst protection
            overload_kill_enable => false % kill the whole node, not just the logger
         },
         %% only keep what you must
         filters => [
           {audit_filter, {fun my_project:audit_filter/2, state}}
         ],
         filter_default => stop,
         %% Keep structured logs to one line
         formatter => {flatlog, #{
           map_depth => 3,
           term_depth => 500 % bigger term depth
         }}
       }
    }
  ]}
 ]}
].
There are three logging handlers defined. The first one is the standard output we've seen so far. Then we have the error handler on disk.
Basically this handler's configuration will cancel out any logs that are below the error level, will store important errors to disk on a file with a given storage retention policy and some implicit overload handling. The overload handling allows things such as log burst windows, memory and message queue protections, and toggling between synchronous and asynchronous logging based on performance. Since disk writing is unpredictable, those are pretty critical features in a large system. All the details for the overload protection can be found in the user guide.
The audit handler is last. It has a longer retention than the error log file (which has a much shorter rotation period based on the file count), and will expect a custom filter in my_project:audit_filter/2, which will pick and choose audit logs to filter in. You'll note that I explicitly disabled overload protection on audit logs: not being able to leave an audit trail should be a critical problem that prevents further action. Non-repudiation is a serious thing.
You'll notice that the audit logs also require a full file synchronisation on logs every few milliseconds and that all handler operations are synchronous. This lets us, through logs, make pretty sure that we reach some form of stable storage before moving on. If you must really get absolute certainty, the logger_disk_log_h:filesync(audit_log) call will do it.
You might want your audit logs to not use disk files. You could instead create an audit handler that would send the logged data structures to an external service inline, or prefer to forward the logs on disk at a later point based on performance and safety requirements. Hell, you could do it on a per-log basis where financial information requires a full blocking whereas user logins and logouts can be handled with less safety.
This is almost flexible enough to be the scary aspect-oriented programming (AOP) that changes execution semantics from afar that your parents told you to avoid!
Expanding Scope
Distributed Tracing
There's even fancier stuff you can do. Remember that when we touched on the handlers and filters, I made an important point of stating that they both run within the process that currently runs. This turns out to be very interesting for distributed tracing.
Distributed tracing is kind of cumbersome to set up at the application level: beyond your logs and your metrics, you need to set up a bunch of trace ids, spans, and metadata, and to set their starting and ending points. This is usually annoying as hell, and people reasonably stick distributed tracing a layer beneath the application. You read the span information in a web server's middleware, and add it to outgoing requests through a similar adapter in some SDK or HTTP client. Then you at least get spans at a service-level scope.
But here's what's neat. Since you arguably already have span handling at the middleware level, you can automatically and cheaply add support for additional sub-spans based on logs data. I wrote a small prototype log handler to demonstrate this, based on the opencensus Erlang client.
This library expects that you may have structured logs in your system which already respect a kind of "request --> response" log sequence, or possibly if you use a structure similar to what you'd get in message-passing systems where you implement CQRS with commands and events, where commands represent a demand intended on the system, and an event can represent the action(s) that has taken place following a command.
You configure it with information such as:
[
  {kernel, [
     {logger, [
         {handler, opencensus, tracelog_handler,
          #{open_close_pairs => [
                % {key name, {open val, close val}}
                {type, {command, event}},
                {part, {request, response}},
                {trace, {start, stop}}
            ],
            name_keys => [what, span]
           }
         }
     ]},
     {logger_level, info}
  ]},
  ...
].
This one works by establishing keyword pairs of terms that represent respective start/stop of events, with potential fields describing names for spans. Whenever such event pairs are encountered, the logging handlers will automatically open and close an opencensus span. Since opencensus uses the process dictionary, this will integrate fine with any other spans that had been declared before. Take the following logs for example:
ping() ->
    ?LOG_INFO(#{type => command, what => "ping_many"}),

    ?LOG_INFO(#{type => command, what => "ping_1"}),
    Res1 = gen_statem:call(?MODULE, ping, infinity),
    ?LOG_INFO(#{type => event, what => "ping_1", result => Res1}),

    ?LOG_INFO(#{type => command, what => "ping_2"}),
    Res2 = gen_statem:call(?MODULE, ping, infinity),
    ?LOG_INFO(#{type => event, what => "ping_2", result => Res2}),

    case {Res1, Res2} of
        {pong, pong} ->
            ?LOG_INFO(#{type => event, what => "ping_many", result => ok,
                        text => "ping working fine"}),
            ok;
        _ ->
            ?LOG_WARNING(#{type => event, what => "ping_many",
                           result => error, details => {Res1, Res2},
                           text => "could not get two pings to work"}),
            {error, badping}
    end.
This isn't a particularly pretty bit of code since it logs too much to be of any use, but it's there to demonstrate a point. You call ping/0 and you'll then see the following in zipkin (or any other distributed tracing tool of your choice):
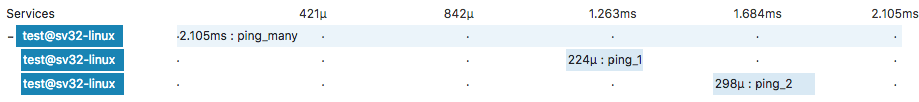
That's pretty useful, although I haven't yet had the opportunity to try it in a production system to see how viable it is. But I think it's pretty neat to be able to lift existing logging code and suddenly get new visibility into what's going on for essentially no additional cognitive cost.
Metrics
I'm not a fan of carrying metrics over logs, but some services and architectures encourage it. One of the fancy things you can do with log line filters is remove or add specific information to log reports.
If you must use logs for metrics, you could have a single logging point or map with all the data you can think of:
?LOG_INFO(#{
    what => http_response, status => 200, ...
    metrics => #{
        init => 1032, db_start => 1034, db_end => 1042,
        format => 1043, response => 1046, ...
    }
})
In practice the call might look more like ?LOG_INFO(#{..., metrics => Metrics}) since you wouldn't store all timestamps literally like in the previous example, but you get the gist. We don't necessarily know ahead of times which metrics will be interesting to report on. It might be database-specific information and full request duration for users, but for implementers it might be very important to know how long formatting takes.
Rather than merging all of that data down ahead of time and calculating intervals that might not be relevant, filters can be used for such transforms:
    user_metrics_filter(Event=#{msg := {report, Msg=#{metrics := Metrics}}}, _) ->
        NewMetrics = #{
            db_delay => maps:get(db_end, Metrics) - maps:get(db_start, Metrics),
            response_time => maps:get(response, Metrics) - maps:get(init, Metrics)
        },
        %% filter out old metrics map, and add new values to the map instead
        NewMsg = maps:merge(maps:without([metrics], Msg), NewMetrics),
        %% substitute the message in the report
        Event#{msg => {report, NewMsg}}.
Applying this filter to the existing log lines will remove information that focuses on what users or support engineers may need, rather than a large data dump that only original developers would know what to make of. The event above could then produce log entries such as:
when=2018-... level=info ... what=http_response status=200 response_time=14 db_delay=8
While this filter modifies the information in minimal ways, you might also couple it to a handler that extracts all metrics and publishes them to a telemetry system such as StatsD or prometheus based on log feeds only.
As a side note, this approach where you only "tag" a few keywords with monotonic timestamps to later extract desired intervals is one of the cleanest functional way to handle metrics generation. This is especially true when you have "per-process" counters, such as gathering metrics for specific HTTP requests, specific transactions, and so on, but they are handled at varied abstraction levels (the opposite would be node-global metrics, which are easier to handle with a mutable counter.)
One example of this is in vegur, a proxy library that contains a small HTTP client, handles proxying logic, and must report up to a router it knows nothing about. To do this, it generates an internal queue of metrics it keeps in memory for the client, and another one on the server side, on each connection. That way, the server side and the client can be called interchangeably without caring about each other nor how metrics fit in the whole picture. When they're done, metrics queues are returned, and the part that handles proxy logic above them can merge the queues. It then exposes them back to the router. The router can maintain its own metrics log, which it fills with route-selection metrics and other data. At the end, the router reports metrics by merging all known queues and extracting the desired and relevant time intervals from their various keys.
The end result is a rather fast, well-scoped set of composable data structures that allow cross-cutting metrics to be reported over multiple components without breaking any layer of abstraction nor requiring any further collaboration between libraries.
I would not generally advise to handle metrics as logs, but in some cases, it could be reasonable and you have the flexibility to do it. There are other more reasonable uses to log filters of this kind, such as scrubbing away stray passwords, session cookies, or other private details you might want to avoid and that could have slipped through.
Which Fields Logs Should Contain
Structured logs are the most useful when you can define common fields that all your applications will respect in terms of semantics. It kind of is annoying when you're in a distributed system, and all the services use any of user, user_id, uid, id, and so on, and in an interchangeable manner. Querying and analysing logs is near impossible then.
So here's some of the log fields our team at Genetec has adopted and decided to standardize on:
| Name | Type | Needed | Description | Examples | Notes |
|---|---|---|---|---|---|
when |
ISO 8601 |
✔ |
The timestamp (with timezone information) at which the event has taken place. If the information is not available, the time of output can be substituted. Try to put this key first in the final format so logs can easily be sorted. |
2018-07-11T13:41:10+00:00 |
A fractional portion of a second (milliseconds, microseconds) can optionally be added before the timezone. |
level |
enum |
✔ |
log level according to RFC 5424: |
debug |
automatically generated by the logger call |
id |
uuid |
✔ |
a unique identifier for the log line, event, or command |
10ba038e-48da-487b-96e8-8d3b99b6d18a |
|
parent_id |
uuid |
|
a unique identifier for the parent event or command, if any. Allows to define hierarchies of events and build a trace |
10ba038e-48da-487b-96e8-8d3b99b6d18a |
Useful when distributed tracing is not present; lets someone do it by hand |
correlation_id |
uuid |
|
a unique identifier for all requests or logs in a group of commands, if any. Allows to define families of events all related to an initial request or user action. |
10ba038e-48da-487b-96e8-8d3b99b6d18a |
Useful when distributed tracing is not present; lets someone do it by hand |
at |
string |
✔ |
an indicator of where in code the call or log line was emitted |
module:function:line |
|
duration |
integer + unit |
If an event has a known duration, this value can let you output that. The unit must be included with the time duration. |
213s |
Avoid using floats in time units; instead use the next smallest integer. |
|
log |
enum |
✔ |
A value defining the type of information conveyed by the log line. Can be either event, command, or trace |
event |
an event denotes something that has happened, and a command an order or a request being given. The trace value is for any internal log line not meant to be either an event or a command. |
in |
string |
✔ |
The subcomponent taking action and logging data. If judged useful, can contain a hierarchy. |
myrel |
this category should be chosen based on filtering needs, and may represent the domain of concern for some operations |
what |
string |
✔ |
A value defining the purpose of the event or command that took place |
http_req, rest, user_input, connection, connection_open, connection_close |
this value can be arbitrary since the in value provides context across components, but it may help to stick to common terms. |
result |
string |
The result of a given operation being reported. |
ok |
Clarify the cause of a bad result in a follow-up field, such as `details` |
|
details |
string |
Additional information explaining the result |
timeout |
||
src |
map |
A map containing information regarding the source of a message, request, or connection |
{"src": <Src map>} |
fields defined in the table below |
|
dst |
map |
A map containing information regarding the destination of a message, request, or connection |
{"dst": <Dst map>} |
fields defined in the table below |
|
text |
quoted text |
Human readable content |
"could not load item \"a\" after 4 attempts" |
||
attempt |
int/int |
On a mechanism that is allowed to retry multiple times, set the counter as a fraction, starting from 1 up until the limit. Attempt 5/5 would mean the final attempt allowed |
1/10 |
||
pid |
integer |
process identifier for a given worker or resource |
1412 (OS Pid) |
highest pid level possible in the abstraction layers |
|
proc |
integer |
process identifier for an OS process |
1412 |
use if an higher-level pid exists and is also relevant |
And for the Src/Dst maps:
| Name | Type | Needed | Description | Examples | Notes |
|---|---|---|---|---|---|
host |
string |
domain name of the computer |
gateway-071.example.org |
avoid specifying useless names like "localhost" |
|
port |
integer |
port number being contacted |
8080 |
||
ip4 |
ip |
ipv4 address |
10.11.12.13 |
||
ip6 |
ip |
ipv6 address |
2001:db8::ff00:42:8329 |
||
mac |
string |
mac address |
aa:bb:cc:dd:ee:ff |
Another set of standards we adopted concerns HTTP requests since they're very frequent for API calls of all kinds:
| Name | Type | Needed | Description | Examples | Notes |
|---|---|---|---|---|---|
code |
integer |
✔ |
HTTP response code |
200 |
Only mandatory on a response result, not on a request that never managed to get out (leave empty) |
status |
string |
HTTP Status String |
OK |
human-readable value supporting the returned code. May contain useful information in some cases |
|
path |
string |
✔ |
The URL path being queried |
/ |
be careful not to include personally identifiable information |
agent |
string |
The user agent of the request |
Mozilla/5.0 (Windows NT 10.0; Win64; x64; rv:62.0) Gecko/20100101 Firefox/62.0 |
as a client, the name of the HTTP library and version is likely more useful. As a server, the submitted user agent string can be useful as well. |
|
req_size |
integer |
The size of the request data, in bytes |
1203 |
||
resp_size |
integer |
The size of the response data, in bytes |
2048 |
||
<other> |
??? |
To be defined |
You should feel free to adapt and tweak these as you see fit. It's not prescriptive and is likely not going to work for everyone everywhere. It just helps when an organization uses all of the same logs, and while it would help to do it with libraries, it's kind of easy to patch things up to fit together by using filters, as we showed with metrics.
Rewriting dynamically is costlier than just letting the logs go through, so depending on volume you may want to avoid patching things up that way. It also becomes really difficult to associate reported logs to their initial location in code. In fact it might not be a good idea at all, but it kind of shows the flexibility of the logger library.
Conclusion
Hell yes, use the new logger. Get better logs in your system today.